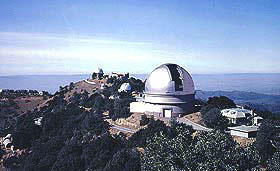

Lick
Observatory, Mt.Hamilton, California
W.
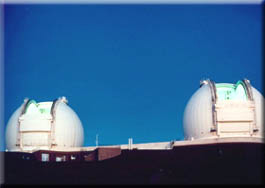
M. Keck Observatory,
Hawaii
|
|
|
|
|
Lick
Observatory, Mt.Hamilton, California
|
W.
M. Keck Observatory,
Hawaii
|
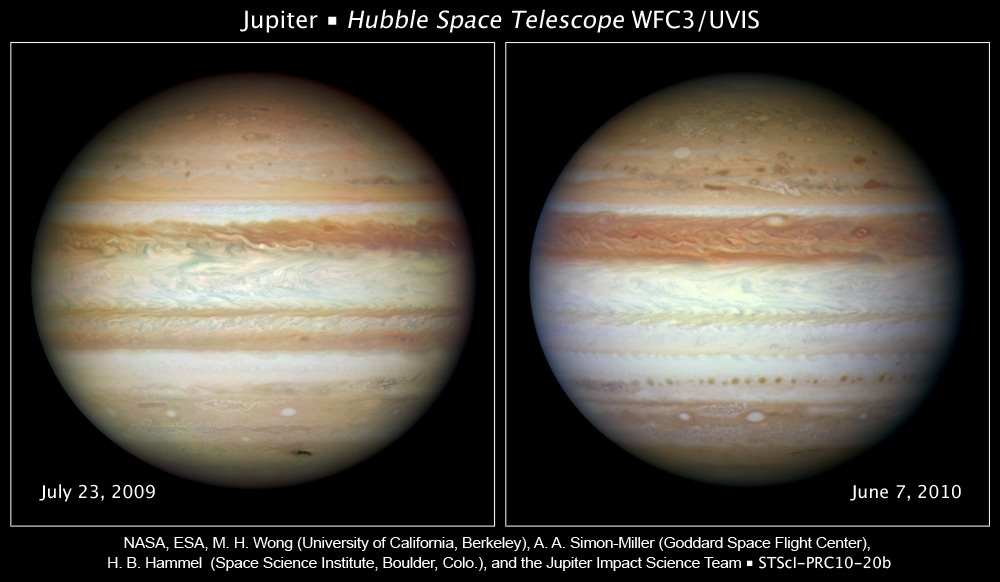
Fading and Revival of Jupiter's South Equatorial Belt (SEB)
One of Jupiter's brownish-red stripes in Jupiter's South Equatorial Belt (SEB) faded out in spring 2010; in November 2010 amateur astronomer Christopher Go of Cebu City, Philippines, noticed a prominent bright spot in the unusually whitened belt, piquing the interest of professional and amateur astronomers around the world. This spot rapidly grew in size and brightness, and is expected to signal the onset of a revival of the SEB.
[Left]: An HST image from July 23, 2009, captures the planet's common appearance over the past several decades with alternating zones of high altitude ammonia ice crystal clouds (white stripes) and belts of lower altitude material (dark stripe).
[Right]: An HST image from June 7, 2010, reveals a slightly higher altitude layer of white ammonia ice crystal clouds that appears to obscure the deeper, darker belt clouds of the SEB. The team predicts that these clouds should clear out in a few months.
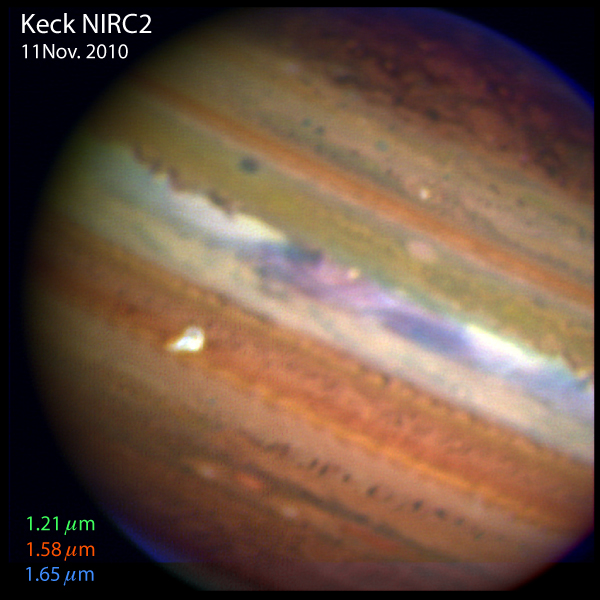
False color images of Jupiter and the SEB outbreak taken with the 10-meter W.M. Keck telescope in Hawaii on UT November 11, 2010, just 2 days after the initial discovery of the "outbreak".
This false color composite is constructed from images taken in narrow-band filters centered at 1.21 micron (green), 1.58 micron (red), and 1.65 micron (blue). At 1.21 and 1.58 micron we see sunlight reflected off Jupiter's upper cloud deck - the same clouds that are seen in visible light. The narrow band image at 1.65 micron shows sunlight reflected back from hazes just above these clouds. The bright "spot" in the SEB is the outbreak where winds are lofting particles to high altitudes.
Image Credit: James Graham (University of California, Berkeley and UofToronto/Dunlap Institute), Shelley Wright, Imke de Pater, Michael Wong (University of California, Berkeley) and the W.M. Keck Observatory. Christopher Go (University of San Carlos, Philippines) sharpened the images slightly using the RegiStax software, developed by Cor Berrevoets.
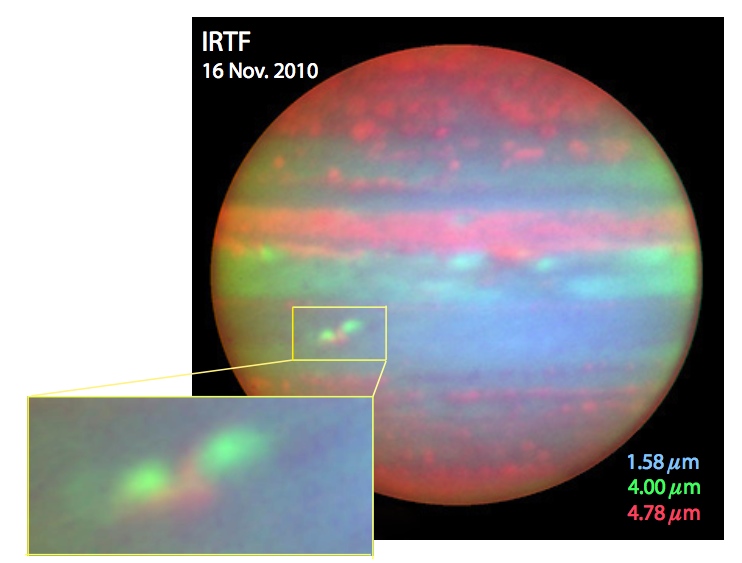
False color images of Jupiter and the SEB outbreak taken with the 3-meter NASA Infrared Telescope Facility in Hawaii on UT November 16, 2010.
This image is a false color composite at three wavelengths that probe diagnostic altitudes in Jupiter's atmosphere: 1.58 microns (blue) sensitive to sunlight reflected from Jupiter's main cloud deck - also detected in visible light; 4.00 micron (green) detects sunlight reflected from higher-altitude particles well above the main deck; and 4.85 (red) micron detects the thermal emission arising from the tops of Jupiter's clouds, with the hottest emissions coming from the deepest atmosphere, and signifying regions with minimal overlying cloud cover. The prominent region just to the left of the center, and expanded in the insert, shows the region of the South Equatorial Belt (SEB) outbreak. The initial outbreak is identified at the upper right, with a second outbreak to the lower left. Between them, in red, is a region of clear atmosphere, probably the result of downwelling from the easternmost plume. In the coming weeks, further outbreaks are expected to take place to the west (left) of those seen in this image. The clear atmospheric regions (in red) will begin to fill this latitude band at the same time as the dark brown color typical of this region returns.
Image credit: Glenn Orton, Padma Yanamandra-Fisher, Gregorio Villar (Jet Propulsion Laboratory, California Institute of Technology), David Griep (Institute for Astronomy, University of Hawaii), Leigh Fletcher (University of Oxford), Imke de Pater, Michael Wong (University of California, Berkeley) and NASA/IRTF.
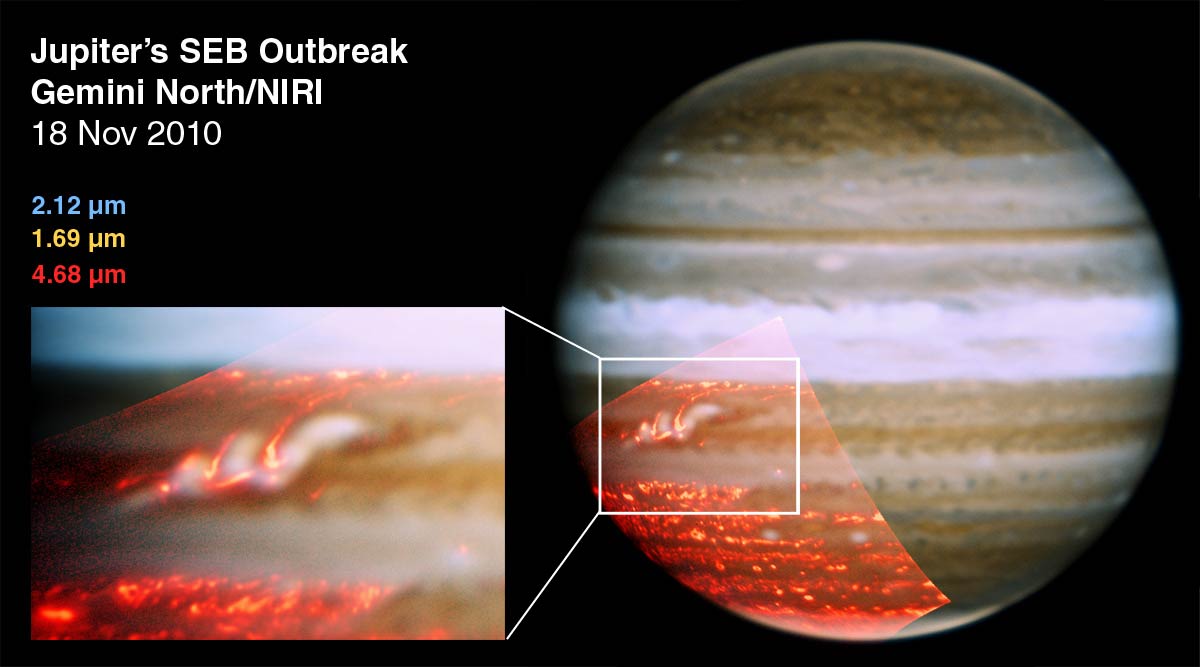
False color images of Jupiter and the SEB outbreak taken with the 8-meter Gemini North telescope in Hawaii on UT November 18, 2010.
This false color composite is constructed from separate images at wavelengths of 2.12 microns (blue), 1.69 microns (yellow) and 4.68 microns (red), with an insert that enlarges the outbreak region. At 1.69 microns we see sunlight reflected from Jupiter's main cloud deck - the same clouds we see in visible light. At 2.12 microns we see sunlight reflected from higher-altitude hazes above the main deck. At 4.68 microns we see thermal emission arising from the tops of Jupiter's clouds, with the hottest emissions coming from the deepest atmosphere, and signifying regions with minimal overlying cloud cover. Note that the brightest areas at 1.69 and 2.12 microns signify regions of the outbreak where winds are lofting particles to high altitudes. In contrast, the dark regions around them (corresponding to visibly blue-gray areas) are clearings in the cloud deck. This is most clearly seen in the longitude-latitude map of the outbreak area shown in the insert. In the coming weeks, further outbreaks are expected to take place to the west (left) of those seen in this image, and the clear atmospheric regions will begin to fill this latitude band at the same time as the dark brown color typical of this region returns. Note that the size of the image at 4.68 microns was smaller than at the other two wavelengths and covered only that portion of the planet that included the outbreak.
Image credit: Glenn Orton, Padma Yanamandra-Fisher (Jet Propulsion Laboratory, California Institute of Technology), Leigh Fletcher (University of Oxford), Imke de Pater, Michael Wong (University of California, Berkeley), Chad Trujillo and Michelle Edwards (Gemini Observatory) and Christopher Go (University of San Carlos, Philippines).