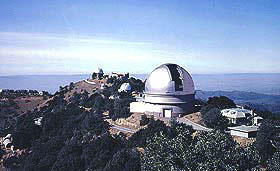

Lick
Observatory, Mt.Hamilton, California
W.
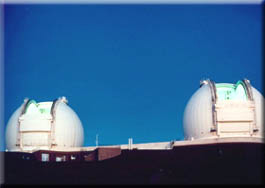
M. Keck Observatory,
Hawaii
|
|
|
|
|
Lick
Observatory, Mt.Hamilton, California
|
W.
M. Keck Observatory,
Hawaii
|
Primary and Secondary Circulation in Jovian Vortices
In a series of papers we derive the vertical structure of and circulation in jovian vortices. We use data at 5 micron, sensitive to Jupiter's deep thermal emission (from levels > 4 bar), and at 0.4-2 micron wavelengths, where the planet is seen in reflected sunlight. In our first paper (ref. 1 below) we derive the primary circulation in Oval BA and the Great Red Spot (GRS), using a new automated cloud-tracking method, referred to as the "Advection Corrected Correlation Image Velocimetry", or ACCIV. We showed that the velocities were nearly the same in 2000 (using Cassini data) when the Oval was white, and in 2006 (from our HST data) when it was red. In Ref. 2 below, we develop a theory for the secondary (vertical) circulation in the ovals, where air is (baroclinically) rising along the center of a vortex in a subadiabatic atmosphere, and descending at a distance not exceeding ~2 x the local Rossby deformation radius. For the small ovals, the air is descending around the outer periphery, producing the 5-micron bright rings. For the Red Oval BA, we postulate that the return flow is at the location of its red annulus, which has a radius of ~3000 km, or twice the local Rossby deformation radius. Adiabatic heating in the descending part of the secondary circulation may result in exposure of condensation nuclei, such as the red chromophores, upon sublimation of the (white) ammonia ice mantles. In Ref. 3 below, we found that the northern red oval has no signature at 5 miron, and we show that these data, therefore, support our secondary circulation hypothesis. This series of papers, focused ultimately on explaining the red color of the annular ring in Oval BA, is contained in:
1. Asay-Davis, X.S., P.S. Marcus, M.H. Wong, I. de Pater, 2009. Jupiter's evolving Great Red Spot: Velocity measurements with the Advection Corrected Correlation Image Velocimetry automated cloud tracking method, Icarus, 203, 164-188.
2. de Pater, I., M. H. Wong, P.S. Marcus, S. Luszcz-Cook, M. Adamkovics, A. Conrad, X. Asay-Davis, C. Go, 2010. Persistent Rings in and around Jupiter's Anticyclones - Observations and Theory. Icarus, 210, 742-762.
3. de Pater, I., M. H. Wong, K. de Kleer, H. B. Hammel, M. Adamkovics, A. Conrad, 2011. Keck Adaptive Optics Images of Jupiter's North Polar Cap and Northern Red Oval. Icarus, 213, 559-563.
4. Wong, M.H., de Pater, I., Marcus, P.S., Asay-Davis, X., and C.Y. Go, 2011 Vertical structure of Jupiter's Oval BA before and 1 after it reddened: What changed?. Icarus, In Press.
5. Marcus, P.S., X. Asay-Davis, M.H. Wong, and I. de Pater, 2011. Jupiter's New Red Oval: Dynamics, Color, and Relationship to Jovian Climate Change. Jornal of Heat Transfer, in press.
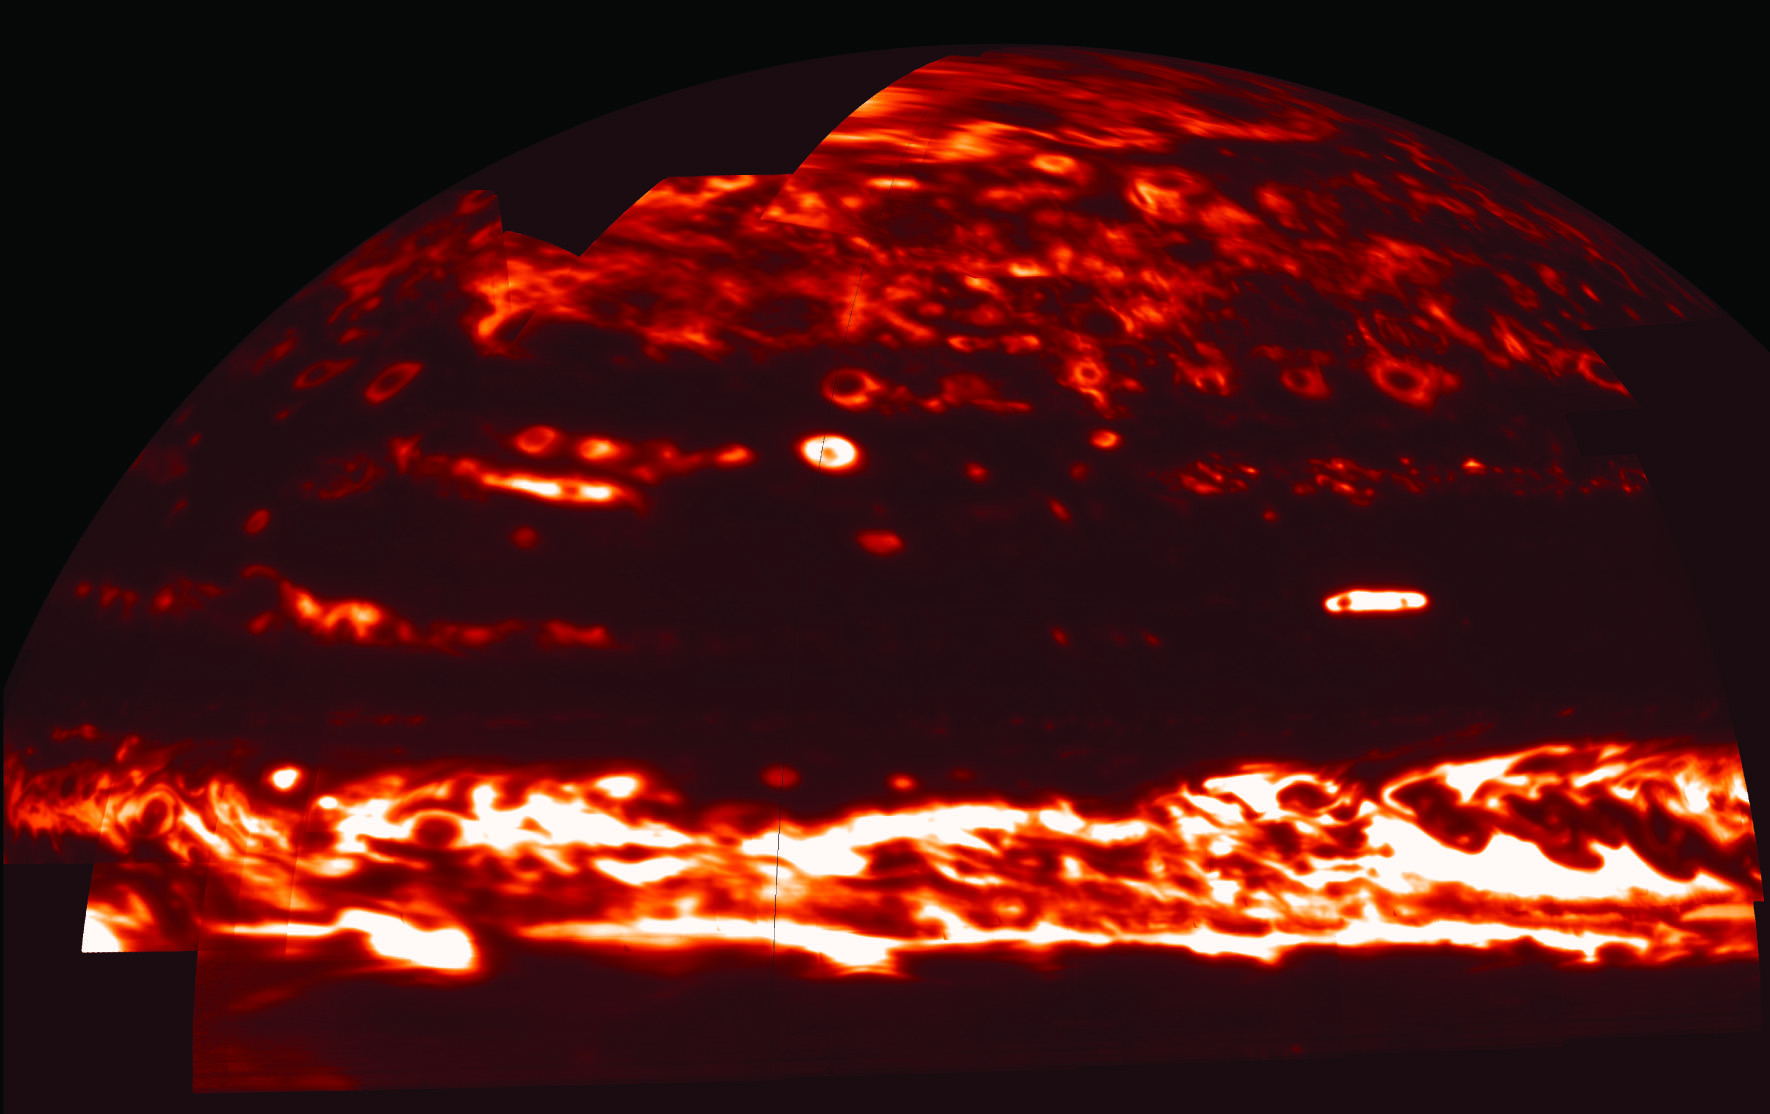
Mosaiced view of Jupiter's northern hemisphere at 5 micrometers. This mosaic was constructed from Keck adaptive optics images, obtained 22 August 2010. Typical brightness
temperatures, are 230-240 K near the northern polar cap, and 250-260 K in the North Equatorial Belt (NEB). (This is Figure 2 from Ref. 3 above).
(a) False-color composite Keck AO image of Jupiter in July 2006. The image was sharpened using the RegiStax software,
developed by Cor Berrevoets. The satellite Io is visible in the upper right corner in the green, red and blue colors of the 1.29, 1.58 and 1.65 micron filters, respectively. The motion
of the satellite with respect to Jupiter during the observing sequence is clearly seen. Io looks larger in the blue because we stretched the colors to "brighten" Jupiter.
Note that the high altitude haze above the polar hood makes the planet blue here. (b) A close-up of the two red spots through the 5-micron filter. The individual images were
deprojected before mosaiced together. (c) The 5-micron image (in orange) superposed on a composite Keck image at 1.58 micron (green) and 1.65 micron (blue). Whether the 5-micron
bright arc on the south side of the GRS is on the boundary of the clouds or in the dark strand below it, is hard to tell. (Fig. 12 from Ref. 2 above)
(a) False-color composite Keck AO image of Jupiter in May 2008, with the satellite Europa in the upper right corner. This image is constructed from images at 1.58
(red), 1.29 (green), and 1.65 (blue) micron. The image was sharpened using the RegiStax software, developed by Cor Berrevoets. As in the figure above, high altitude haze above the polar
hood makes the planet blue here. (b) Mosaic of the area outlined on the composite image at a wavelength of 5 micron. Individual images were deprojected before mosaiced
together. (c) and (d) Detailed view of the tiny ovals south of Ovals A5 and A6. Panel (c) shows part of a 502 nm image; panel (d) shows part of panel (b). In
addition to Ovals A5 and A6 we indicate five regions (1-5) to guide the reader towards ovals and features seen both at visible and 5-micron wavelengths. (e) Close-up view of the
larger ovals, constructed from deprojected HST images at 673, 502 and 410 nm, using red, green and blue colors for the different filters, respectively. (f) The 5-micron image (in
orange) superposed on a composite Keck image at 1.58 lm (green) and 1.65 lm (blue). Although the time between the 1.58/1.65 and 5-micron images was very short, Ovals A5
and A6 had moved slightly compared to the ovals closer to the equator. This figure clearly shows that al small ovals are surounded by 5-micron bright rings, while the larger ones are not. (Fig. 13 from Ref. 2 above).
(a) Deprojected map of Jupiter's Northern Red Oval, from images taken with the adaptive optics system on the Keck telescope (21 August 2010). Images at 1.29 (green),
1.58 (red), and 1.65 (blue) micron were combined to create this 3-color composite. The
oval shows up bright white in this view, at a planetographic latitude of 42 deg. N and
System III West longitude of 45 deg. (b) Deprojected 2-color composite map of Jupiter's
Northern Red Oval. Images at 1.65 (blue) and 5 (red) micron were combined. The oval,
visible at 1.65 micron, is not surrounded by a 5-micron bright ring, in contrast to the
smaller ovals, which all show such rings around their periphery. (Fig. 3 from Ref. 3 above)
Sketch of the circulation in three vortices: (a) a small oval (radius of the 5-mircon rings <3000 km, and the radius of the clouds that make the oval visible in HST data is
roughly half this number); (b) Oval BA, where the clouds extend well beyond the potential vorticity boundary, i.e., the radius of the clouds is >3000 km; (c) the Great Red Spot.
Primary circulations are counterclockwise along isobaric contours in a horizontal plane; they are measured in the cloud sheet, as indicated. At present, wind velocity fields
can only be measured in the larger anticyclones (BA, GRS). The secondary circulation is primarily in the vertical direction, as indicated by the arrows. The pressure at the
center of the vortex (near 2 bar) is anomalously high, as indicated. (Fig. 16 from Ref. 2 above)
Full vortex structure and circulation. Primary circulation is counterclockwise as measured at the cloud sheet, near the vortex midplane. Secondary circulation is shown by arrows with vertical components. Thermodynamic anomalies (the cold core and warm core) are depicted near the top and bottom of the vortex. Estimates for pressures at the vortex top and cloud sheet are from radiative transfer analyses. Estimate for the vortex midplane pressure follows the scaling analysis in Ref. 2 above. Evidence that the vortex bottom extends to the water layer is
discussed in Section 5.2.2 of Ref. 5 above. (Fig. 8 from Ref. 5 above).
North-south velocities of the primary circulation in Red Oval BA along the
principle east-west axis. Comparison of our 2006 HST data
with the velocity profile we determined from the Cassini data taken in 2000.
The approximate location of Oval BA's red annulus is shown
by the shaded region. (adapted from Ref. 1 above)