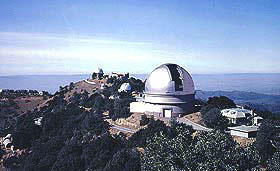

Lick
Observatory, Mt.Hamilton, California
W.
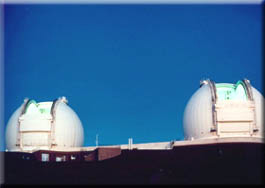
M. Keck Observatory,
Hawaii
|
|
|
|
|
Lick
Observatory, Mt.Hamilton, California
|
W.
M. Keck Observatory,
Hawaii
|
Jupiter's Great Red Spot is Shrinking
We have started a detailed investigation of Jupiter's deep atmosphere, using VLA and 5--micron data. The 5-micron spectroscopic research is led by G. Bjoraker. Two papers resulted sofar:
The observations are published in a sequence of 2 papers:
1. Bjoraker, G.L., Wong, M.H., de Pater, I., Adamkovics, M., 2015. Jupiter's deep cloud structure revealed using Keck observations of spectrally resolved line shapes. Astrophys. J., 810, Issue 2, article id. 122, 10 pp.
2. Bjoraker, G.L., Wong, M.H., de Pater, I., Hewagama, T., Adamkovics, M., Orton, G.S., 2018. The Gas Composition and Deep Cloud Structure of Jupiter's Great Red Spot. Astron. J., 156, 101, 15 pp.
In the first paper we discuss our technique to determine the pressures at which significant cloud opacity is present between 2 and 6 bars. For this technique we use the strength of a Fraunhofer (solar) absorption line in a zone to determine the ratio of reflected sunlight to thermal emission, and we use pressure-broadened line profiles of deuterated methane (CH3D) at 4.66 microm to constrain the region of origin of both the solar and thermal components of Jupiter's 5-micron spectrum through radiative Transfer (RT) modeling. For nearly all latitudes on Jupiter the thermal component is large enough to constrain the deep cloud structure even when upper clouds are present. We find, for example, that Hot Spots and belts have broader line profiles than the Equatorial Zone. Radiative transfer models show that Hot Spots do not have opaque clouds at pressures over 2 bars, whereas the spectrum over a zone requires an opaque cloud between 4 and 5 bars. In the second paper we concentrate on the GRS, and show via a unique analysis using both the 5-micron and Cassini/CIRS data that 3 cloud layers are present in the GRS: the water cloud, NH4SH, and NH3 clouds, just like predicted based on thermochemical models. This is the first time this 3-layer cloud structure has been detected in the GRS, or anywhere on Jupiter. In the same paper we constrain the water abundance to be between 2 and 9 times solar oxygen.

The pressure level of deep clouds on Jupiter as constrained by CH3D line profiles observed in Order 16. An SEB hot spot (gray curve) at 17deg S (labeled B on left image) is fitted without any clouds at pressures greater than 2 bars (pink curve). Hot spot error bars would be smaller than the thickness of the gray curve. The spectrum of the STZ at 32deg S (points with error bars, and labeled A in left image) was modeled using opaque clouds at 2, 4, 5 bars and a model without any deep clouds. We may exclude an opaque NH4SH cloud at 2 bars due to the poor fit of the blue curve to the observed spectrum. The best fit requires an opaque cloud between 4 and 5 bars. Thermochemical models predict that cloud opacity at this pressure level is due to a water cloud. Note the factor of 50 difference in radiance scales between the hot spot and the zone spectra. The calculated transmittance above Mauna Kea for 2 mm precip H2O is shown as a dashed blue line. T denotes a telluric H2O line and S denotes a solar (Fraunhofer) line.

Contribution functions of Jupiter between 4.66-5.32 micron compared with MWR (Microwave Radiometer) channels on the Juno spacecraft (Janssen et al. 2017). On the left-hand side, the Galileo probe temperature/pressure profile (Seiff et al. 1998) is shown in red for comparison.

Example spectra (from Ref. 2) of the Great Red Spot (GRS). Left: Comparison between IRTF/iSHELL spectra of the GRS (left-hand axis) and of the Warm Collar (right-hand axis) at 4.66 micron. The Warm Collar is 13 times brighter than the GRS. The best fitting model of the GRS and a model of the transmittance of the atmosphere above Mauna Kea are also shown. Transmittance scale (not shown) is 0–1.04. Telluric lines are denoted by T and solar lines by S. Right: Comparison between Keck/NIRSPEC spectra of the GRS (left-hand axis) and of a Hot Spot (right-hand axis) at 4.66 micron. The Hot Spot is 36 times brighter than the GRS. The NIRSPEC spectrum of the GRS is nearly identical to that obtained by iSHELL. The same radiative transfer model fits both Keck and IRTF spectra of the GRS. It was only necessary to change the spectral resolution, Doppler shift, and telluric water abundance to match each dataset.

Simplified cloud model for the GRS, as derived from our data, together with those of Cassini/CIRS. The three cloud layers are shown with significant opacity at 0.57 bar, ~1.3-2.3 bars, and 4-6 bars next to a Galileo Probe temperature, pressure profile. The transmittances of these same three clouds are 25%, 7.4%, and 0%, respectively. The upper cloud has an albedo of ~17%.