|
Jupiter
|
From Jupiter we
receive both thermal and nonthermal emissions. |
|
|
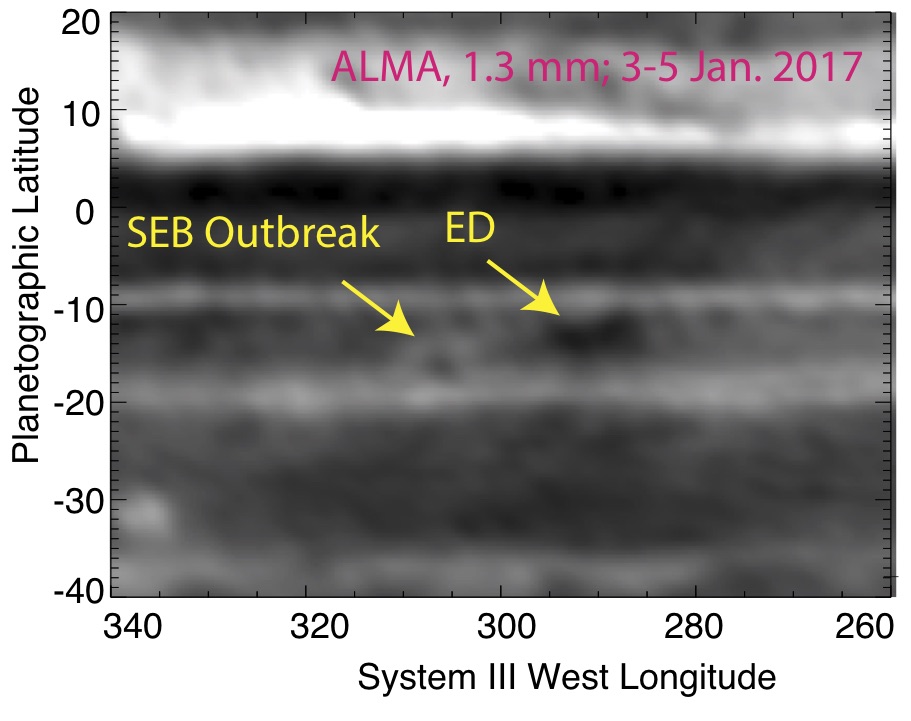
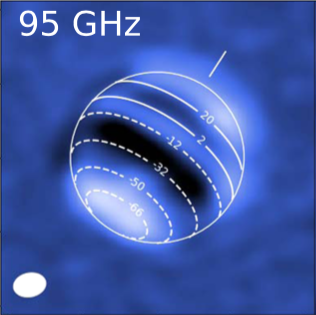
First ALMA Millimeter-wavelength Maps of Jupiter,with a Multi-Wavelength Study of Convection. (click to
enlarge image and get more information about this
research). (CREDITS: Imke de Pater (UC Berkeley), Robert J. Sault (Univ. Melbourne))
|
|
|
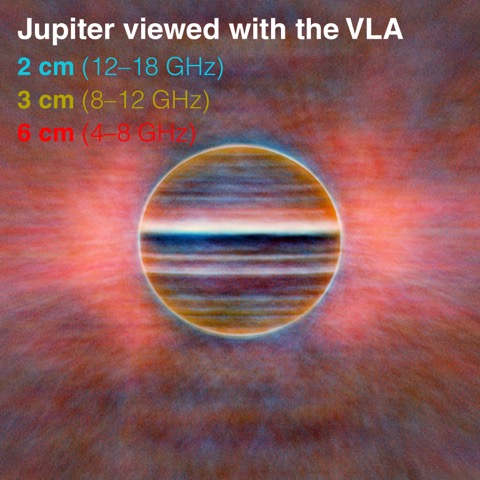
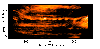
Peering through Jupiter's clouds:A radio image of Jupiter from the VLA at three wavelengths: 2 cm in blue, 3 cm in gold, and 6 cm in red (click to
enlarge image and see radio maps of the planet). A uniform disk has been subtracted to better show the fine banded structure on the planet. The pink glow surrounding the planet is synchrotron radiation produced by spiraling electrons trapped in Jupiter's magnetic field. Banded details on the planet's disk probe depths of 30-90 km below the clouds. This image is averaged from 10 hours of VLA data, so any longitudinal structure is smeared by the planet's rotation. (CREDITS: Imke de Pater, Michael H. Wong (UC Berkeley), Robert J. Sault (Univ. Melbourne))
|
|
|
Radio images of Jupiter:This 4-panel photograph (click to
enlarge image) shows longitude-smeared images of Jupiter at wavelengths
of 2, 3.5 and 6 cm; the latter image shows the total emission (thermal
+ nonthermal), as well as an image where the nonthermal (synchrotron)
radiation was subtracted. These images were taken close in time with
the Galileo probe entry into Jupiter's atmosphere, Dec. 7, 1995. (Ref:
de Pater, I., D. Dunn, K. Zahnle and P.N. Romani,
2001. Comparison of Galileo Probe Data with Ground-based Radio
Measurements. Icarus, vol. 149, 66-78.
|
|
|
First
longitude-resolved radiomap of Jupiter:The image at left is a radio image
of Jupiter at 2cm, derived from VLA observations taken on 25 January
1996. The data were taken by Imke de Pater (UC Berkeley), and were
further reduced and imaged by Chermelle Engel (University of Melbourne)
and Bob Sault (ATNF).
(Sault, R.J., C. Engel, and I. de Pater, 2002. Topographic imaging
of Jupiter at radio wavelengths. Icarus, submitted.)
|
|
|
Impact of comet
D/Shoemaker-Levy 9 with Jupiter:SL9 (6 panel image) The impact of
comet Shoemaker-Levy 9 with Jupiter in July 1994 drastically changed
the radiation characteristics of Jupiter's synchrotron radiation.
The observations can largely be explained using a model of enhanced
radial diffusion of the radiating electrons, as well as a direct acceleration
of the electrons by the upward propagating shock. This image shows
data (panels a and b) and models (panels c-f). For details see Brecht,
S.H., I. de Pater, D.J. Larson, and M.E. Pesses, 2000. Modification
of the Jovian radiation Belts by Shoemaker-Levy 9: An Explanation
of the Data. Icarus, vol. 151, 25-38.
|
|
|
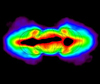
Jupiter's synchrotron radiation:Energetic electrons trapped in Jupiter's
magnetic field emit synchrotron radiation. The image at left (click
to enlarge image) is a false-color image of this emission, at a Jovian
longitude of 312 degrees. The data were obtained with the Very Large
Array at a wavelength of 20 cm. We overplotted magnetic field lines
at an equatorial `distance' of 1.5 and 2.5 Jovian radii (from Jupiter's
center) (from Jack Connerney's O6 magnetic model). (Ref: de Pater,
I., M. Schulz, and S.H. Brecht, 1997. Synchrotron evidence for Amalthea's
influence on Jupiter's electron radiation belt. J. Geoph. Res., vol.
102, pp. 22,043 - 22,064)
|
|
|
Three-dimensional tomographic reconstruction of Jupiter's nonthermal radio emissivity. We used R.J. Sault's 3D
Fast Fourier Transform algorithm on the VLA data shown at left, and
R. E. Gooch's visualization software package for displaying and making
movies (click to view enlarged image plus movie). (Ref: de Pater and
Sault, 1998. An intercomparison of 3-D reconstruction techniques using
data and models of Jupiter's synchrotron radiation. J. Geophys. Res.
vol. 103, pp. 19,973-19,984)
|
|
Io
|
From Io we
receive thermal emission from its (sub)surface and atmosphere. |
|
|
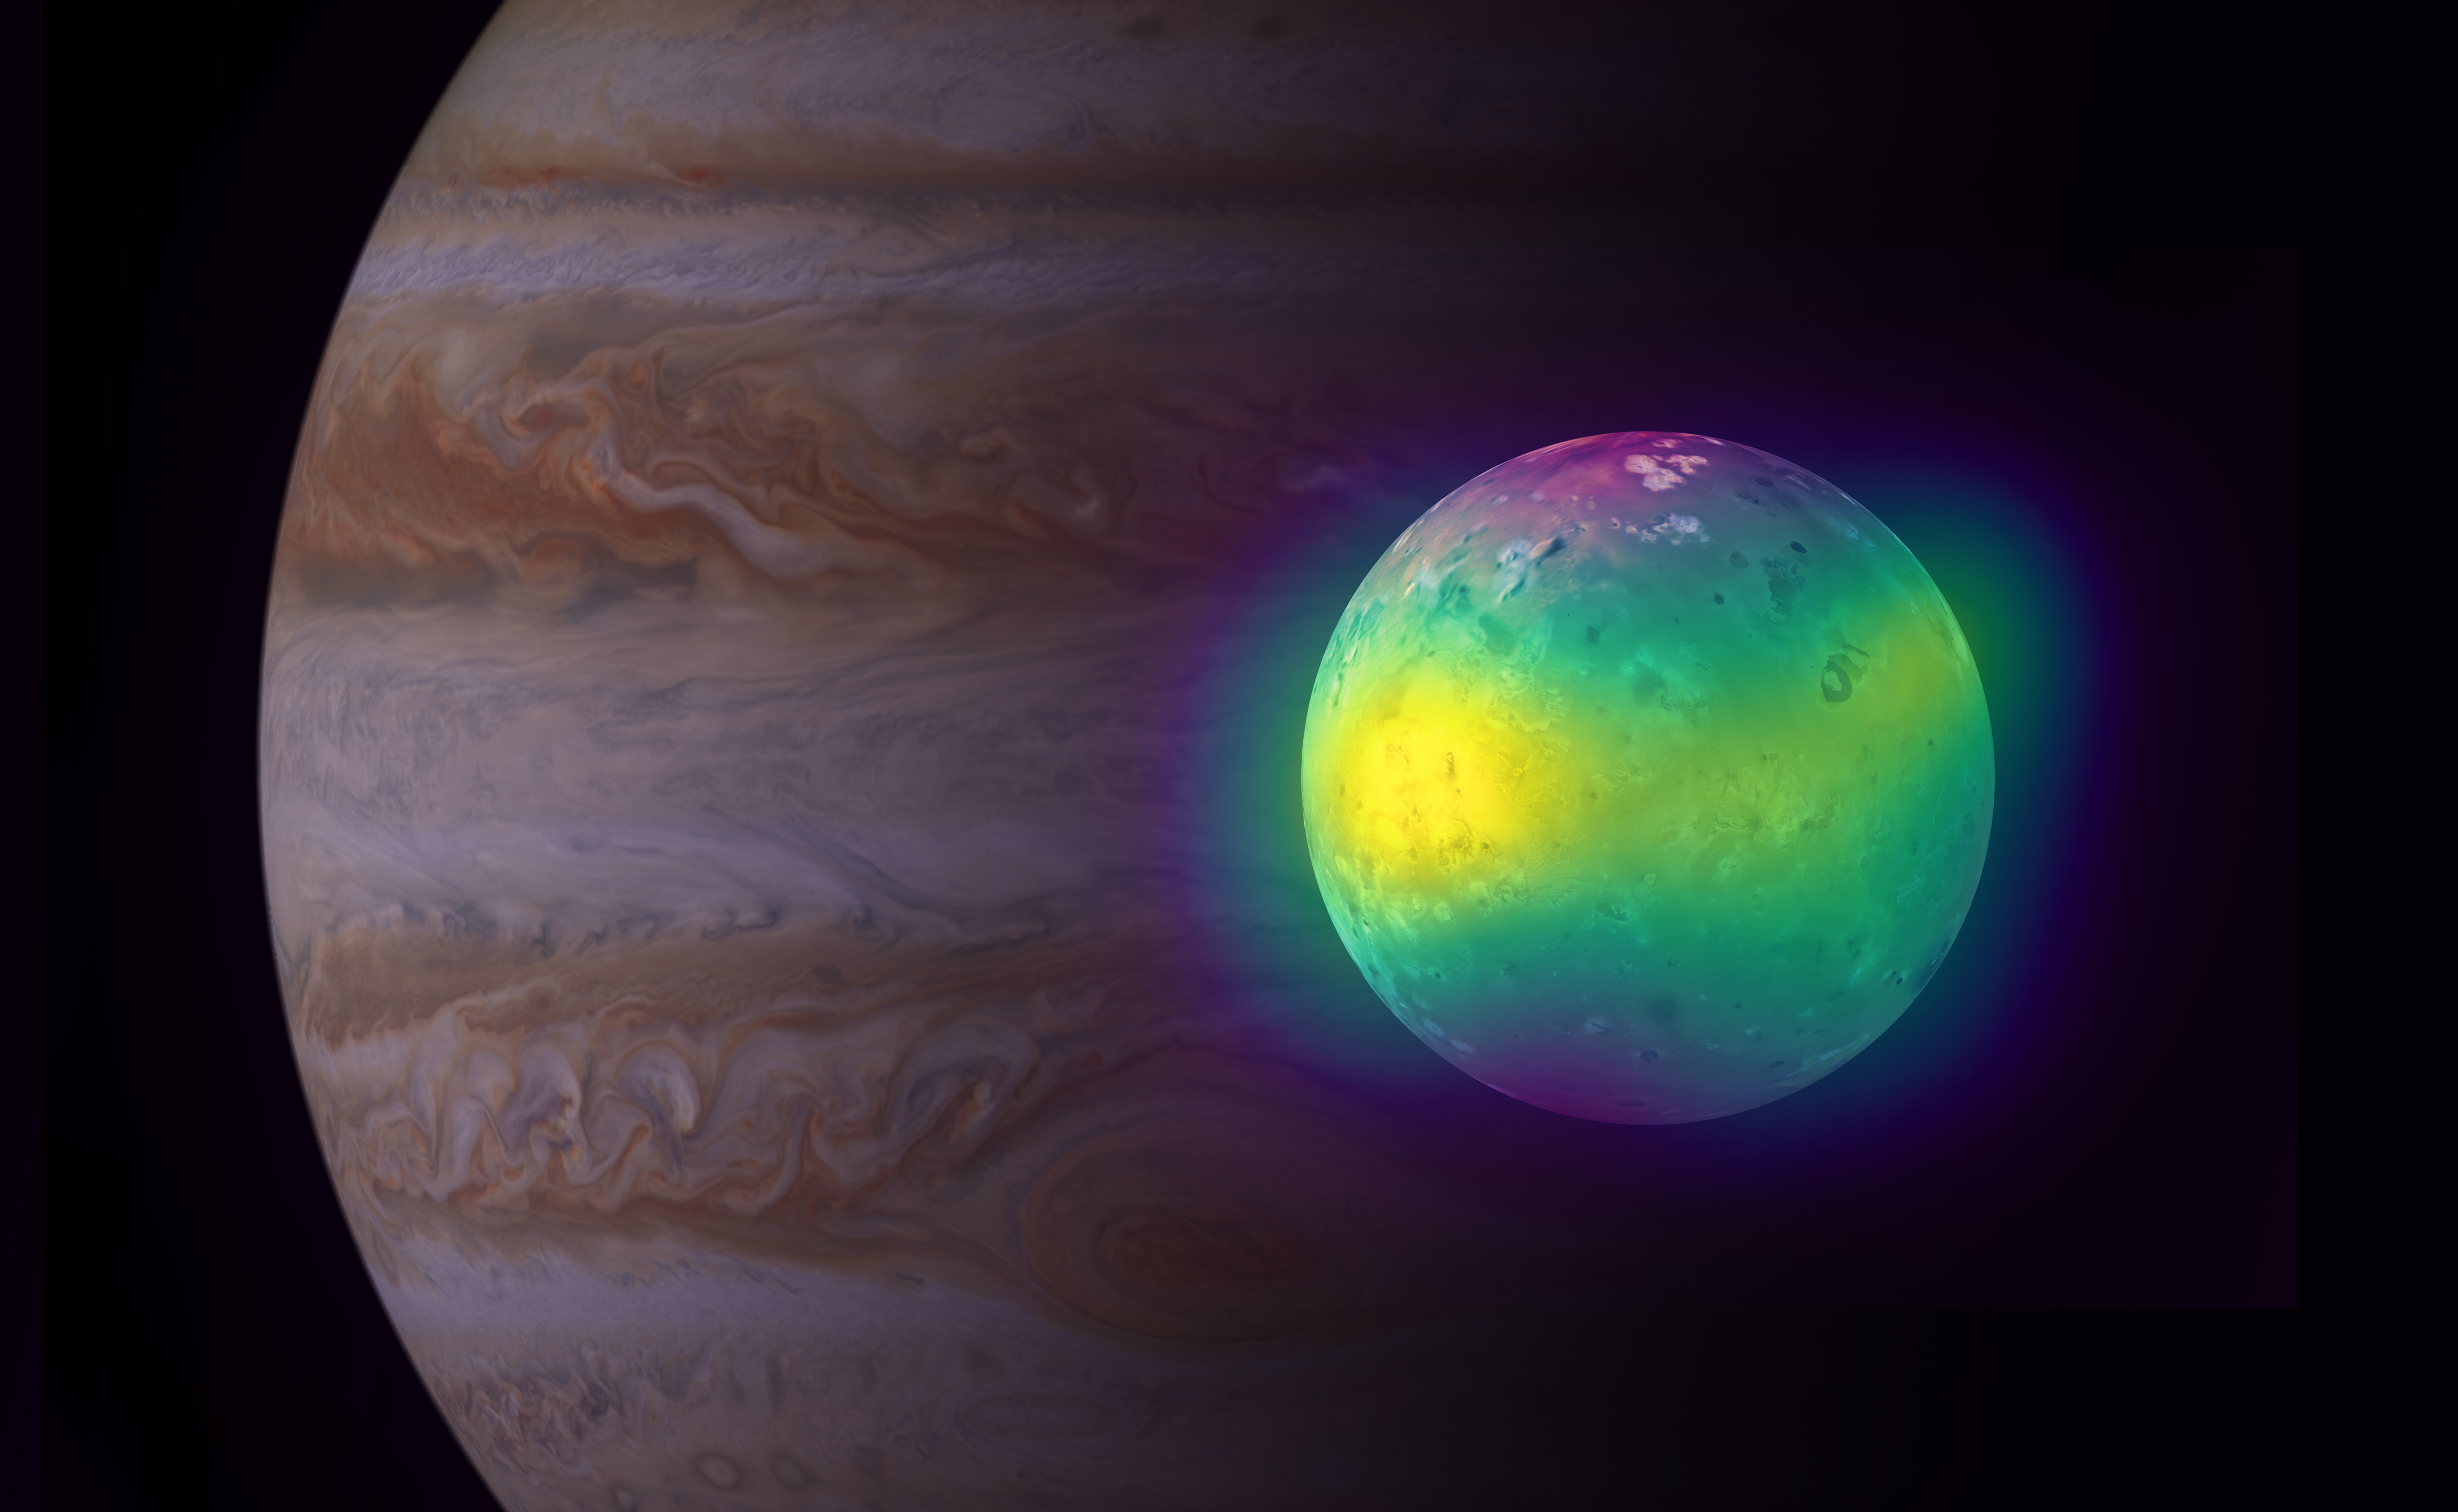
A composite image of Io, in front of a Cassini photo of Jupiter. The observations for the first time show plumes of sulfur dioxide (yellow) rising up from Io's volcanoes. (click to
enlarge image and get more information about this
research). (CREDITS: Imke de Pater (UC Berkeley); ALMA;
S. Dagnello/NRAO; NASA/ESA)
|
|
Saturn
|
We receive thermal radiation
from Saturn itself and its rings; the latter emission is dominated by
Saturn's thermal emission reflected off the rings. |
|
|
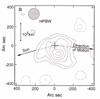
VLA
Observations reveal the effect of mega-storms in Saturn's atmosphere. More images and information are shown when clicking on the
icon.
|
|
|
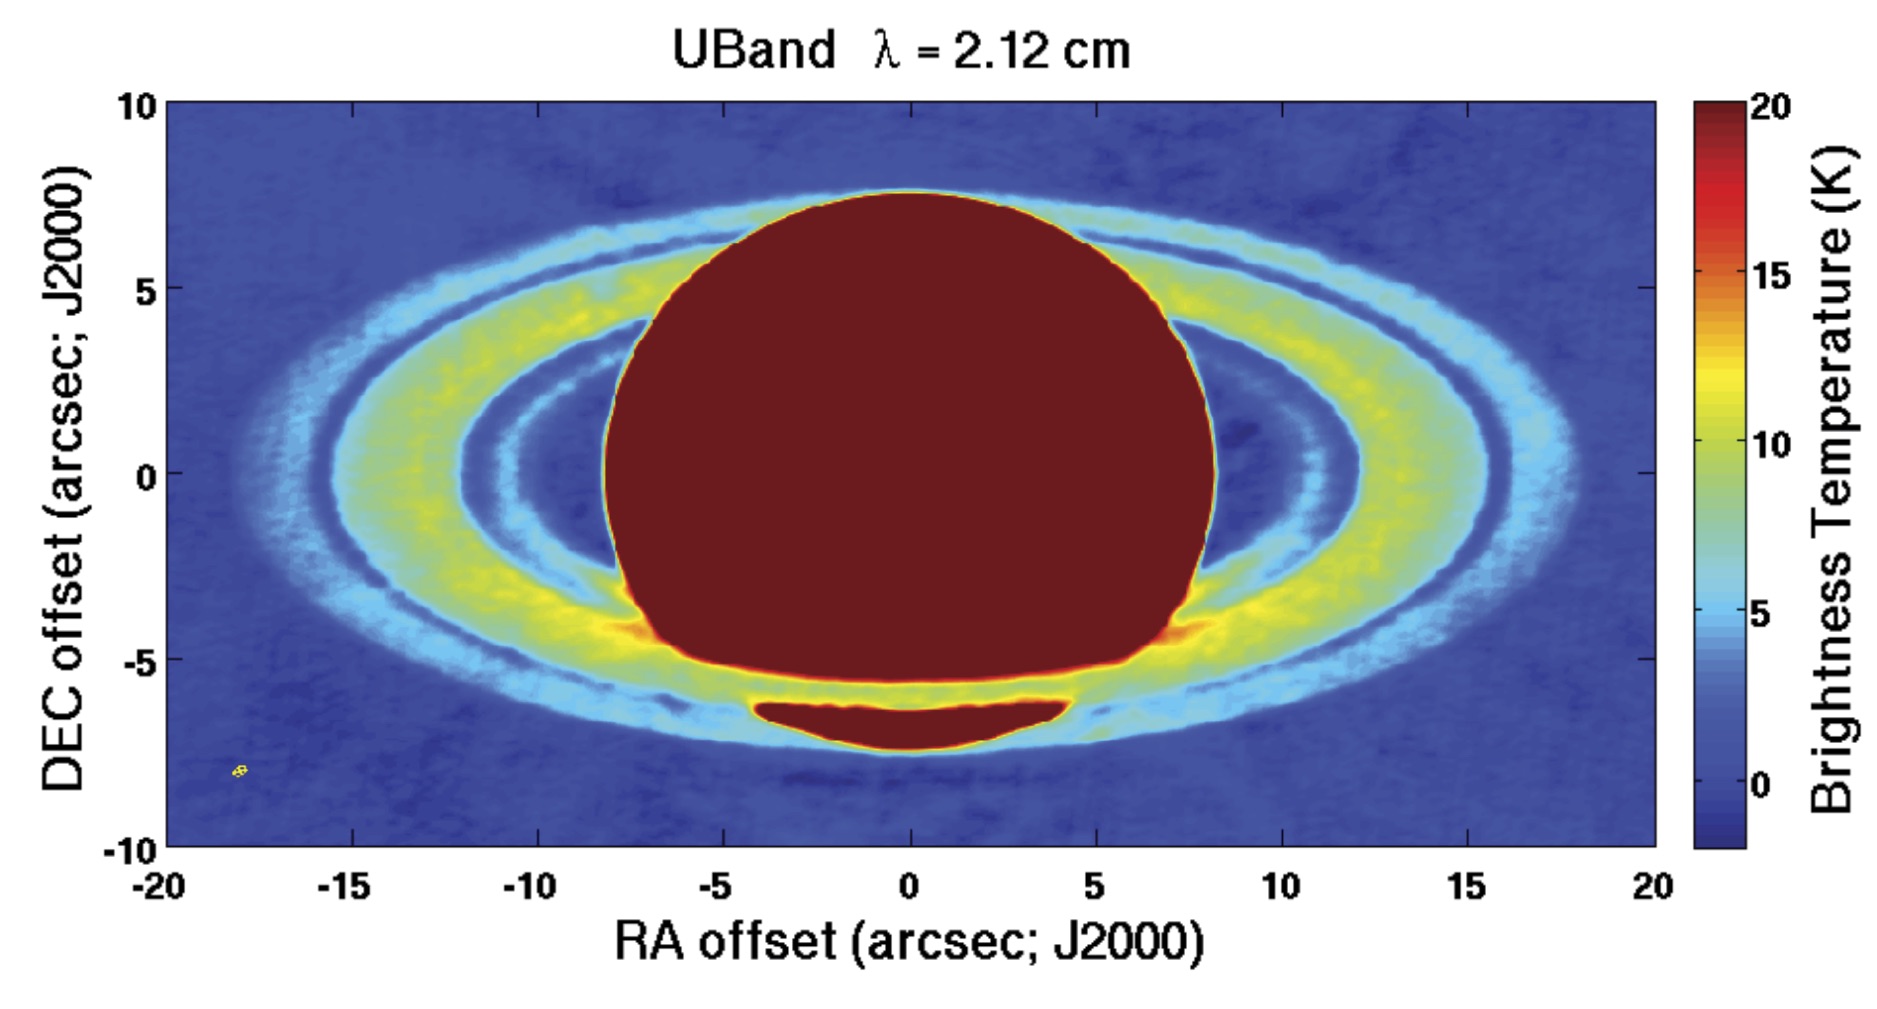
Saturn observed at a wavelength of
2 cm with the upgraded VLA in
2015. More images and information are shown when clicking on the
icon. Figure from: Zhang, Z., Hayes, A. G., de Pater, I., Dunn, D. E., Janssen, M. A., Nicholson, P. D., Cuzzi, J. N., Butler, B., Sault, R.J., Chatterjee, S., 2019. VLA multi-wavelength microwave observations of Saturn's C and B rings. Icarus, 317, 518-548.
|
|
|
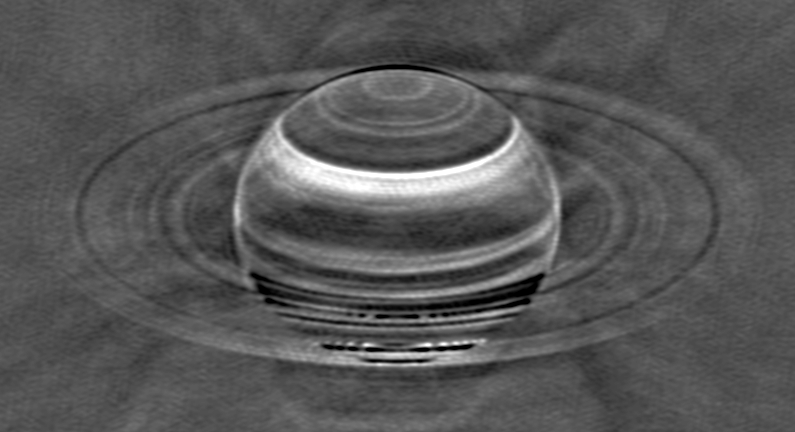
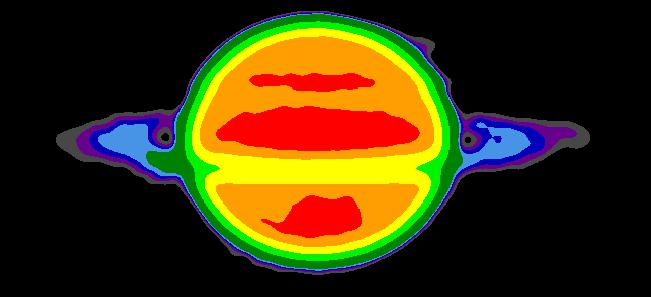
Saturn observed at a wavelength of
2 cm with the VLA in Sep. 1994. Note the brighter (hotter) bands
on Saturn, similar in appearance to Jupiter's banded
structure. Saturn's main rings are easily distinguished too. More images are shown when clicking on the icon.
|
|
Uranus
|
We receive thermal radiation
from Uranus itself, and recent ALMA images revealed thermal
radiation also from its rings. |
|
|
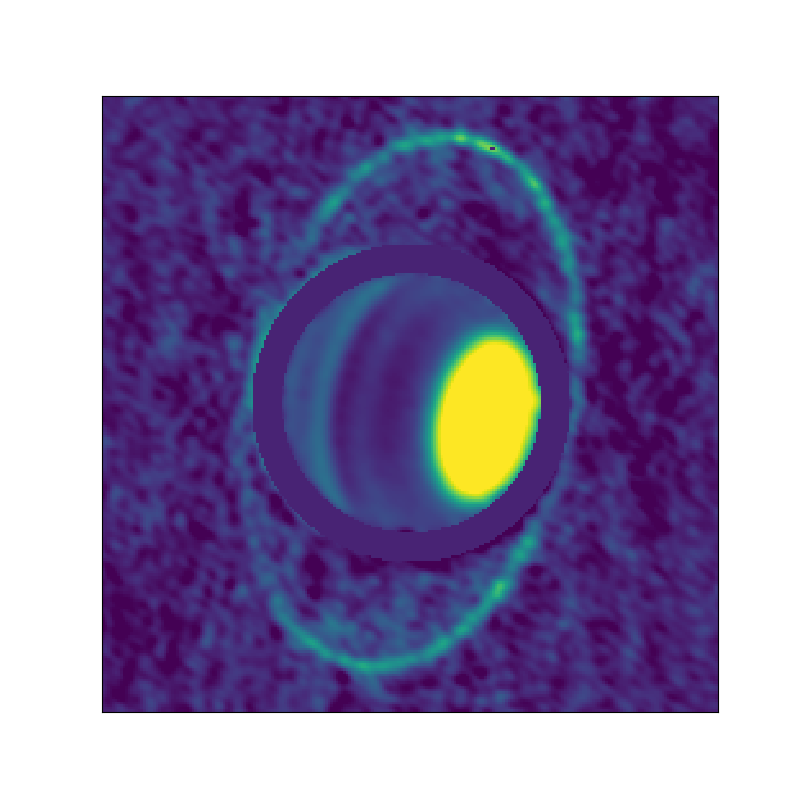
ALMA
detects thermal radiation from Uranus' rings. Click the icon for more information.
|
|
|
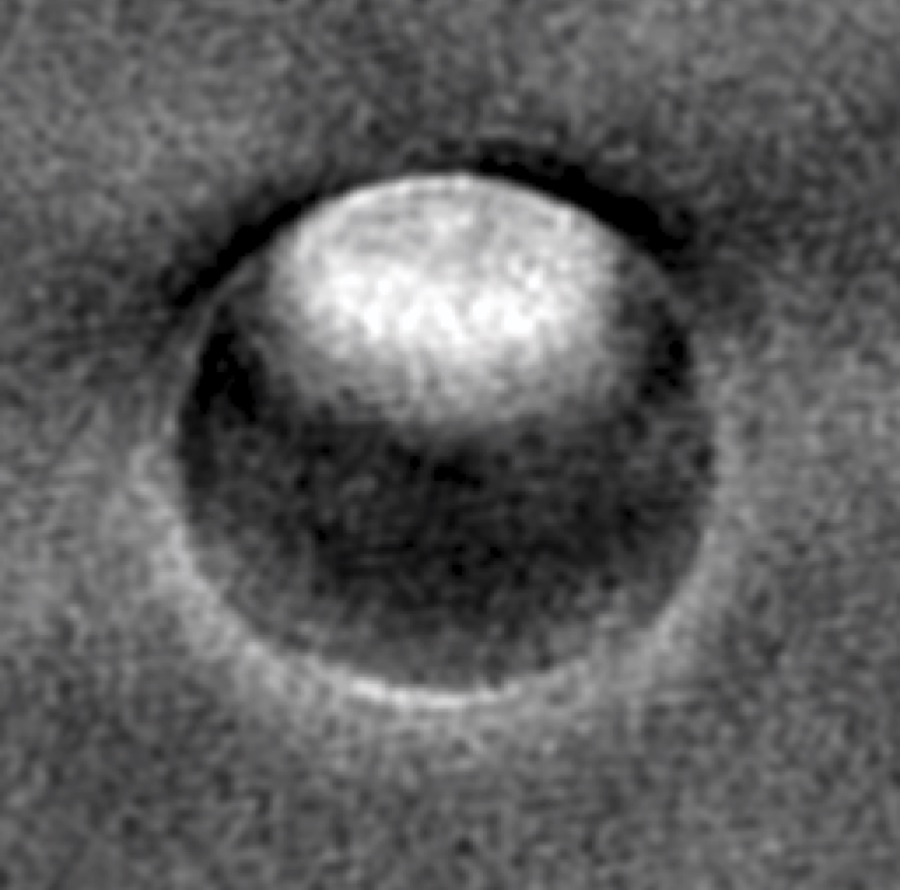
Radio
image of Uranus with the VLA, after the VLA upgrade. Click the icon for more information.
|
|
|
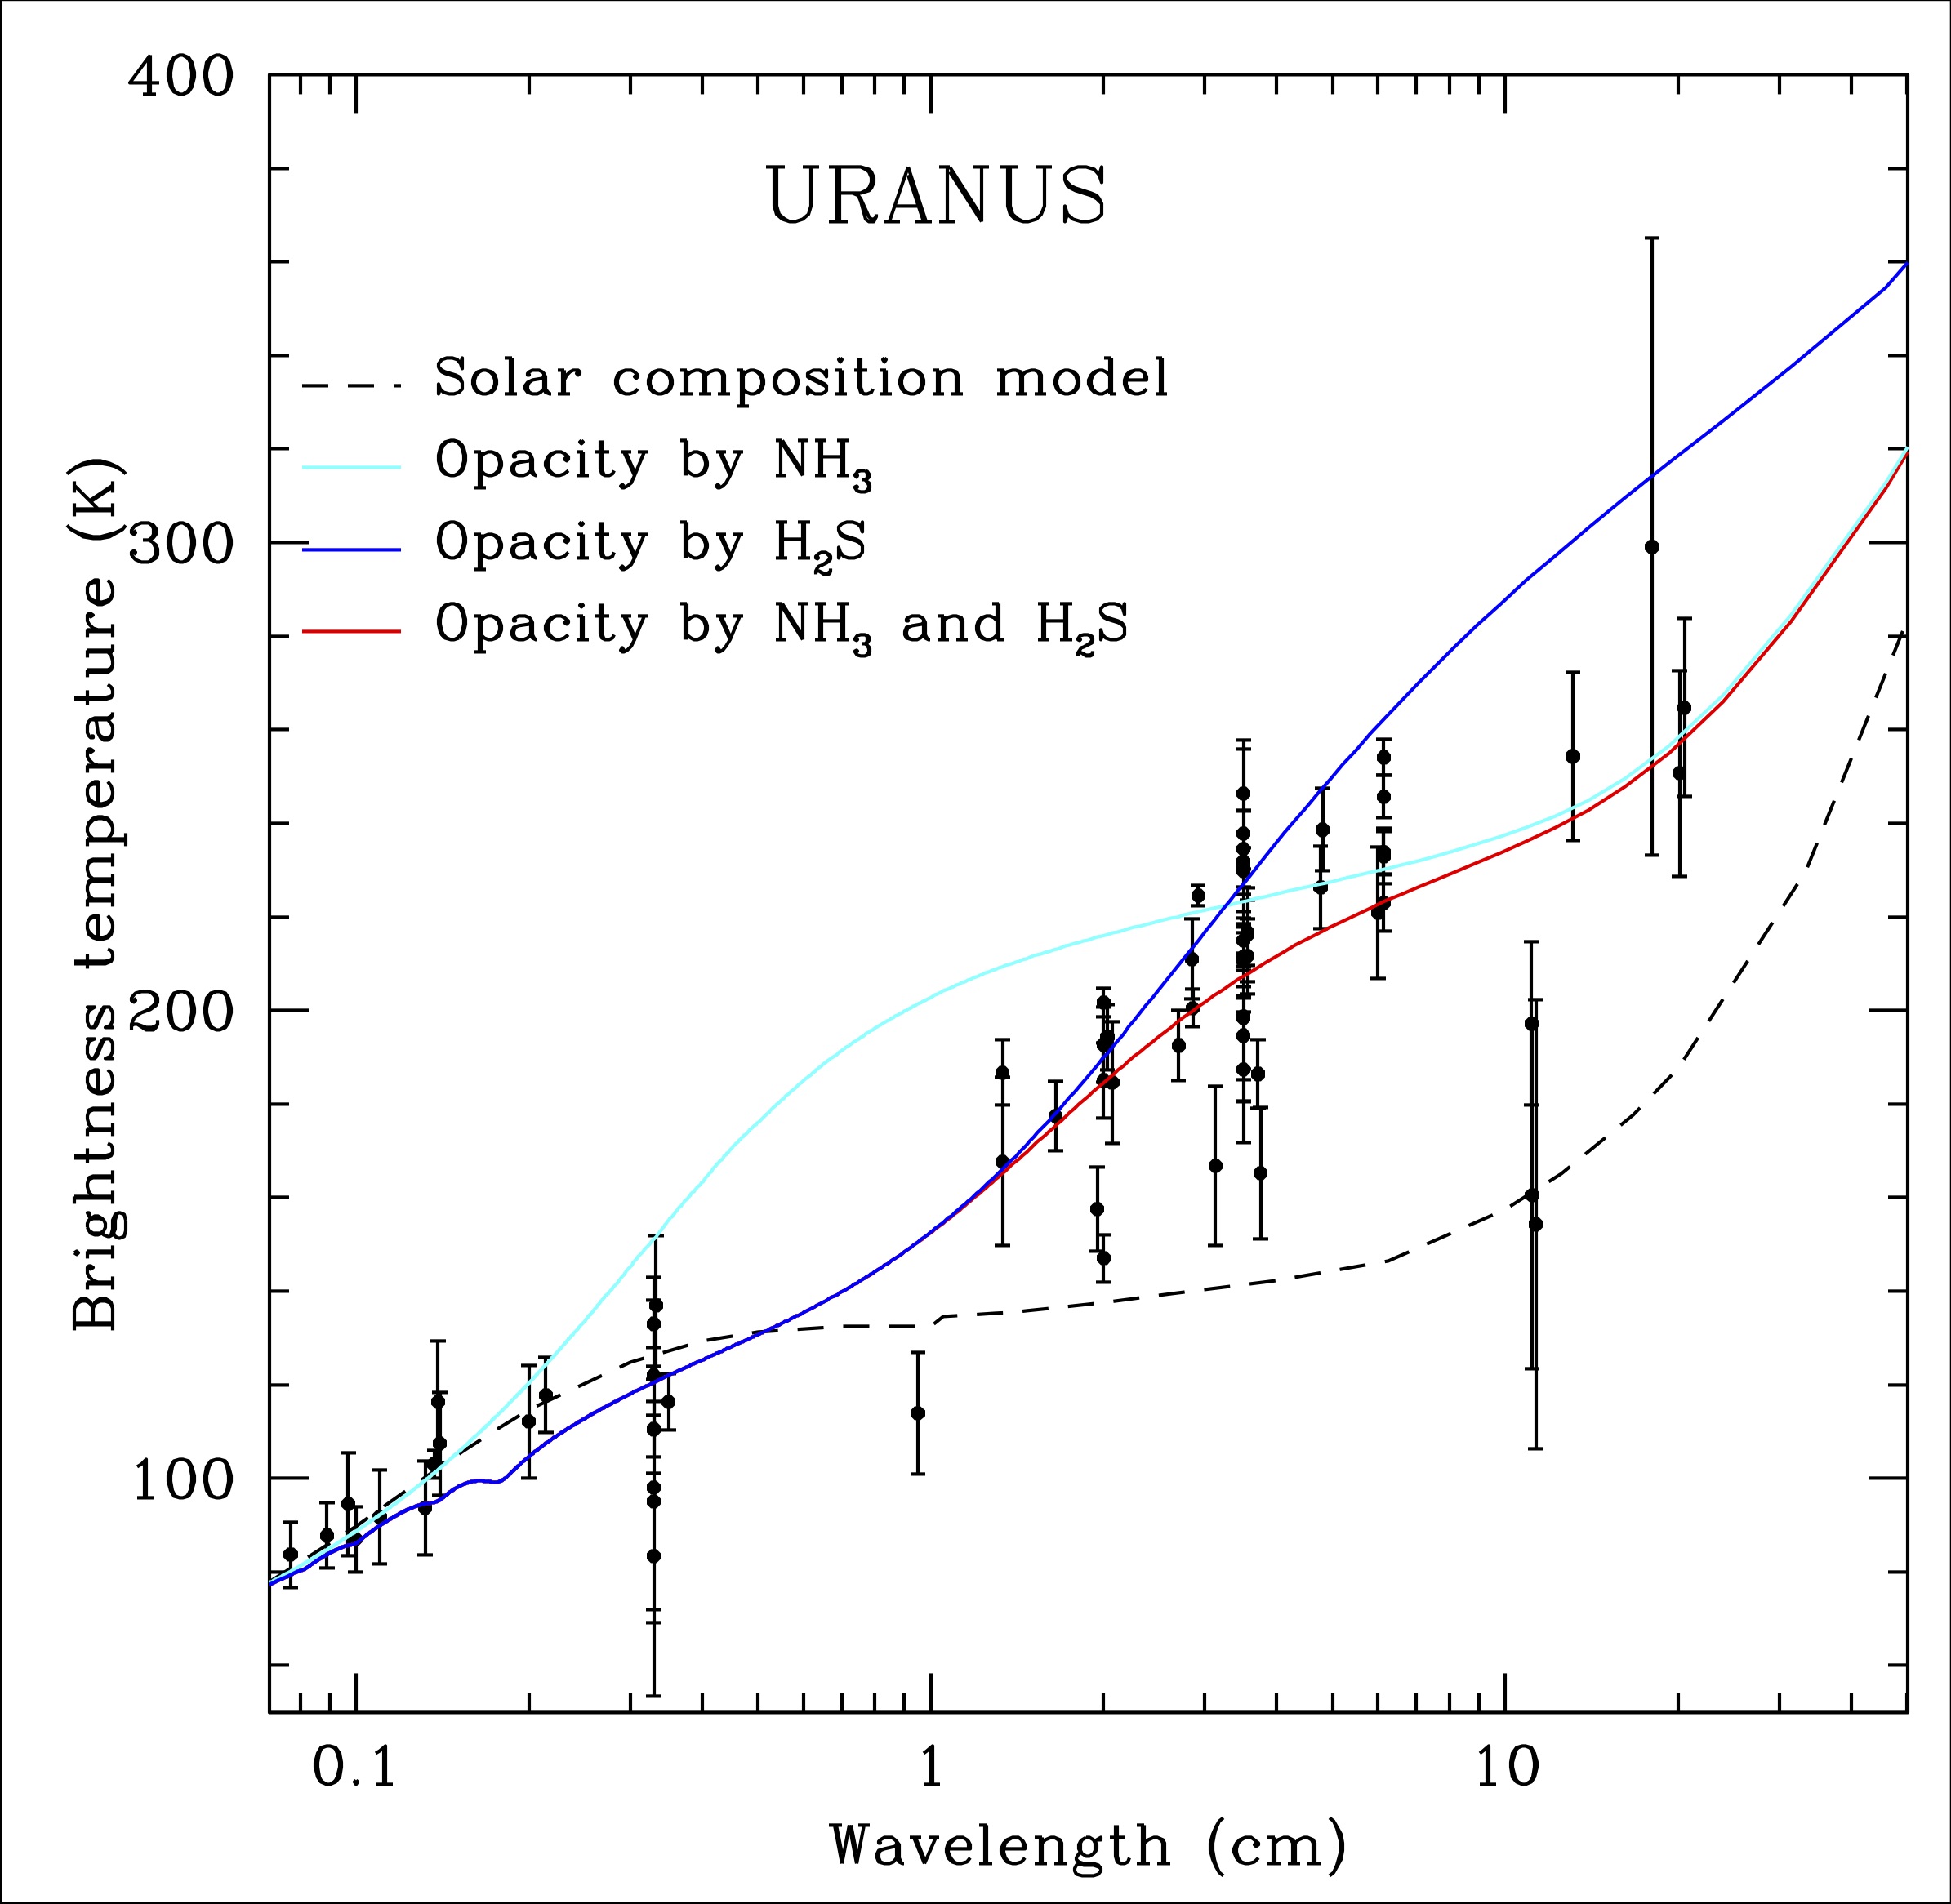
Radio spectrum
of Uranus to show the sensitivity to
different sources of opacity. Click the icon for more information.
|
|
Neptune
|
We receive thermal radiation
from Neptune's atmosphere. |
|
|
Radio
image of Neptune with the ALMA at mm wavelengths. Click
the icon for more information on ALMA observations of Neptune.
|
|
|
Radio
image of Neptune with the VLA, after the VLA
upgrade. Click the icon for more information on Neptune's radio
spectrum, images and global circulation model.
|
|
Comets
|
Comet overview... |
|
|
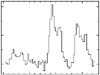
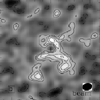
Our group is involved in imaging OH
(maser) emission from comets using the VLA, and the thermal emission
from molecules such as HCN, CS and the H2CO-ion with BIMA. Examples
are shown of an OH image from comet Halley (taken with the VLA in
Nov. 1985)[upper thumbnail], and an HCN spectrum [middle thumbnail]
and dust emission image [lower thumbnail] from comet Hale-Bopp (taken
in March 1997 with BIMA).
(Refs: de Pater, I., P. Palmer, and
L.E. Snyder, 1986, the brightness distribution of OH around comet
Halley, Astrophys. J. Lett., vol. 304, pp. L33-L36. de Pater, I.,
J.R. Forster, M. Wright, B. J. Butler, P. Palmer, J. M. Veal, M. F.
A'Hearn, and L. E. Snyder, 1998, BIMA and VLA observations of Comet
Hale-Bopp at 22 -- 115 GHz, Astron. J., vol. 116, pp. 987-996. Wright,
M.C.H., I. de Pater, J. R. Forster, P. Palmer, L.E. Snyder, J.M. Veal
M.F. A'Hearn, L.M. Woodney, W.M. Jackson, Y.-J. Kuan, and A.J. Lovell,
1998. Mosaiced Images and Spectra of J=1-->0 HCN and HCO+ emission
from Comet Hale-Bopp (1995 O1). Astron. J., vol. 116, pp. 3018-3028.)
|