Cosmology today is becoming a precision science, with the viable models of structure formation and background cosmology becoming more and more constrained and hence more and more similar. While a detailed comparison between models requires statistical tests it is sometimes useful to compare extreme variants to acquire a visual feel for how things work. That is the purpose of this page.
As we stated earlier most cosmological models today differ primarily in their total density and dark matter content. With few exceptions they are based upon nearly scale-invaraint adiabatic gaussian initial fluctuations, such as produced with inflation.
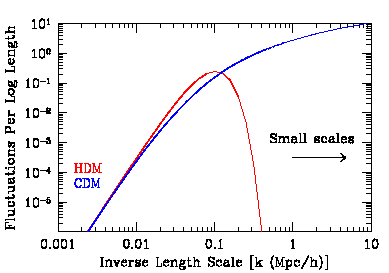
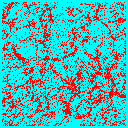
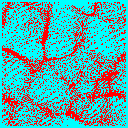
The first major distinction is between cold dark matter and hot dark matter. In the former scenario there is power over a wide range of physical scales, and therefore on small scales, and structure forms beginning with small objects which then merge to form ever larger structures. We call this ``bottom up'' structure formation. The observations strongly favour this scenario over its competitor: ``top down'' structure formation. The proto-typical ``top down'' scenario is structure formation in a universe dominated by hot dark matter. Hot dark matter cannot support fluctuations on small length scales -- they are washed out by the rapid motion of the particles. Thus only large scale fluctuations (larger than the velocity of the particles time the age of the universe) survive to the present epoch. Structure forms first large scale objects which fragment into smaller objects.

The figure above shows the average fluctuation amplitude as function of (inverse) length. Small scales are to the right on the figure. Notice that the CDM model has much more power on small scales than the HDM model. We compare ``bottom up'' and ``top down'' structure formation in the two panels below: the left panel shows a slice through a simulation of a CDM universe 300Mpc/h on a side, the right panel the same model with HDM.
| Cold Dark Matter | Hot Dark Matter |
 |
 |
Once we have decided on CDM, the next biggest question is the total matter density in the universe. We could have a high-density universe of mainly CDM, or a low density universe where the bulk of the energy density is in a cosmological constant, curvature or some other form. In the low-density universe, matter ceases to dominate the expansion rate at some point, and thereafter structure stops growing. There is not enough gravitational pull to overcome the expansion of the universe and keep the structures growing. Thus normalized to a given amount of structure today, the low-density universe forms structure earlier.
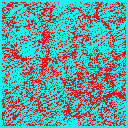
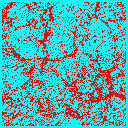
We can see this in the following frames taken from simulations of a critical density universe (top 3 panels) and an open universe with 20% of the critical density in CDM (bottom 3 panels). Each frame is 100Mpc/h on a side, and is a slice 10Mpc/h thick of the whole simulation box.
| z=1.0 | z=0.5 | z=0.0 | |
| Critical: | 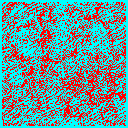 |
 |
 |
| Low density: | 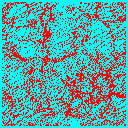 |
 |
 |
In the low density model much of the structure is already in place by z=1, whereas in the critical density model the largest structures are just forming at the present (z=0).
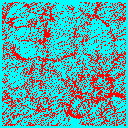
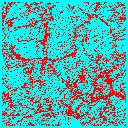
Finally we must distinguish between observations made in ``real space'', i.e. using the exact positions of objects in 3 dimensions, or in ``redshift space'', i.e. using redshift as the 3rd dimension. Because objects are pulled around by gravity, their velocity away from us is not given purely by their distance times the Hubble constant. There is an additional peculiar velocity coming from the acceleration due to objects near them.
Imagine looking out at a field which contains a large overdensity of galaxies stretching across our line of sight. Because this overdensity attracts objects to it, galaxies between us and the overdensity will be moving away from us (towards the overdensity) slightly faster than the Hubble law would predict. Galaxies beyond the overdensity will be moving away from us slightly slower than the Hubble law would predict. In both cases we we would place objects closer to the overdensity than they really are, enhancing the clustering in redshift space.
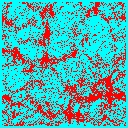
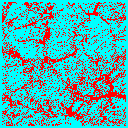
On very small scales the opposite occurs. Imagine a cluster of galaxies in which each galaxy orbits rapidly in the cluster potential well. Though all of these galaxies are at (approximately) the same distance, their line of sight velocities are smeared out by this random motion, leading us to place them at different distances in our redshift space map. In fact this effect will cause objects observed in redshift space to form ``fingers'' pointing along the line of sight (or back to the observer) because it spreads bound objects out in the radial direction. This is known as the fingers-of-god effect. In the simulations below the observer is situated well below each slice so the redshift direction is the vertical direction. The effect is clearly larger in the model with more matter (and hence gravity).
| Real Space | Redshift Space | |
| Critical: |  |
 |
| Low-density: |  |
 |
All of the above has been looking at the large-scale structure traced by objects today. Of course we can also look at the progenitors of these structure in the cosmic microwave background anisotropy. The CMB is exquisitely sensitive to a very large number of cosmological parameters, and is comparitively simple to model. For these reasons we believe it may be a Cosmic Rosetta Stone which enables us to decode the story of structure formation.
We show below how two models of structure formation, one flat and one open, would look in maps of the CMB sky.
 COBE DMR 4-year full sky temperature map of the CMB in galactic
coordinates. The dipole variation due to the Solar System motion has
been removed. The equatorial band is foreground Milky Way radiation.
Elsewhere the colors indicate fluctuations of tens of microKelvin.
The DMRs resolution is 7 degrees. The blowups of a 7 degree circle
indicate the finer detail that might be revealed by the next generation
MAP and Planck satellites.
The left blowup is a simulation of an open Universe and the right is a
simulation of a flat Universe.
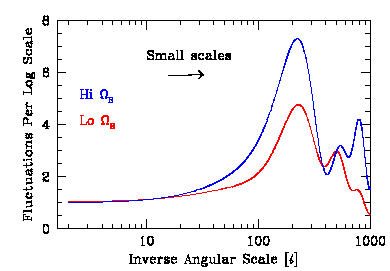
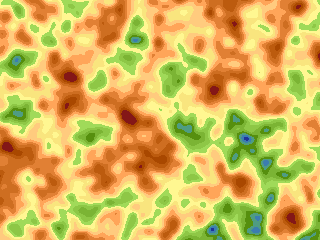
It is also possible to look at the effect of changing the baryon density on the CMB. The baryon density can be predicted by Big Bang Nucleosynthesis to be a few percent of critical density today. We show below two models in which the baryon density is increased from 1% to 10%. Note that as the baryon density is increased the amount of power on small scales goes up.
| Low Baryon Density | High Baryon Density |
 |
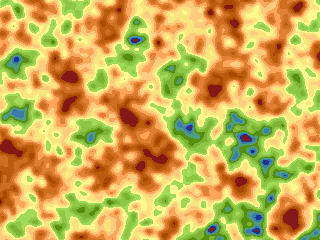 |
The effect can be more clearly seen if we plot the amplitude of the fluctuations as a function of angular scale -- note that increasing the baryon fraction from 1% to 10% has increased the amount of power on smaller angular scales compared to large.
