
Astronomy Night: A Stargazing and Lecture Event!
On the first Thursday of the month come join our department for a lecture and guided stargazing! Visit our events page for full details.
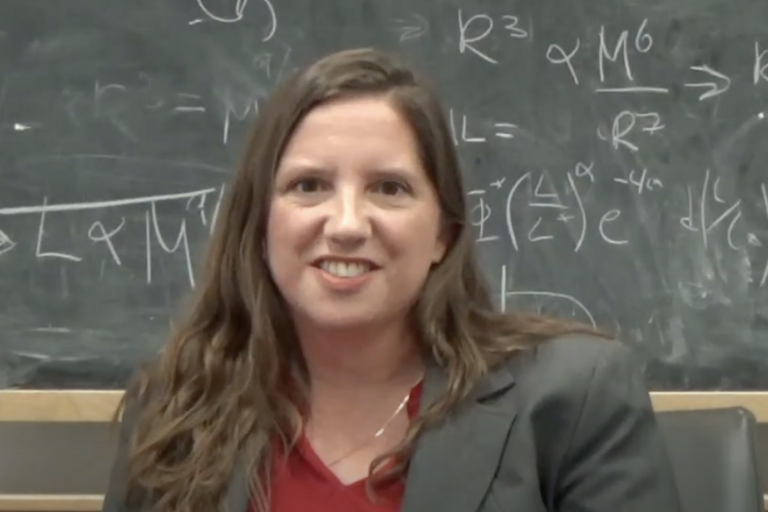
Basic Research Lights the Way
Prof. Chung-Pei Ma and colleagues in Math and Physical Sciences describe the fundamental role basic research plays in furthering our understanding of the universe and the world around us.
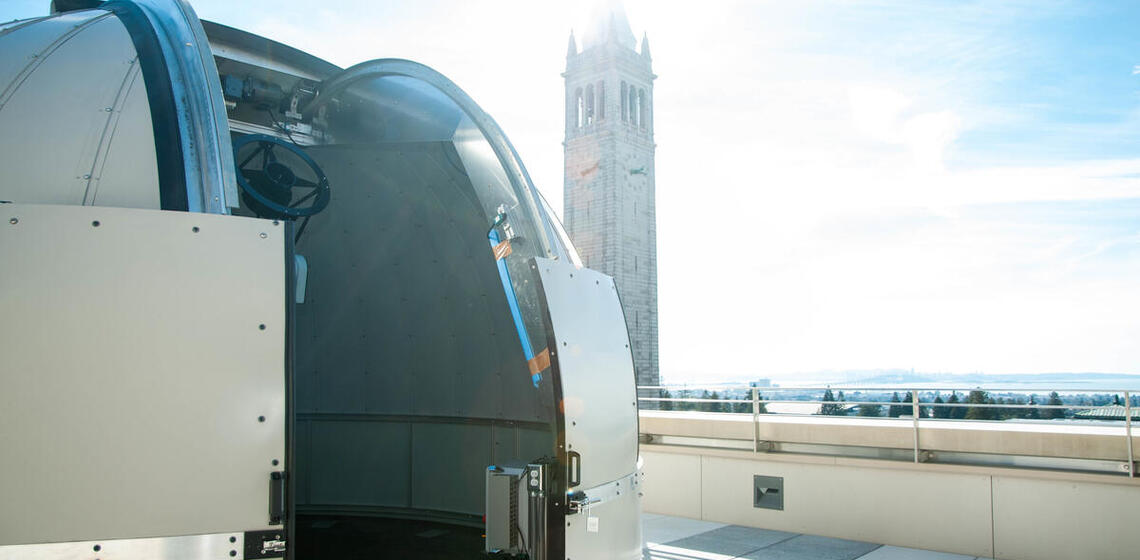
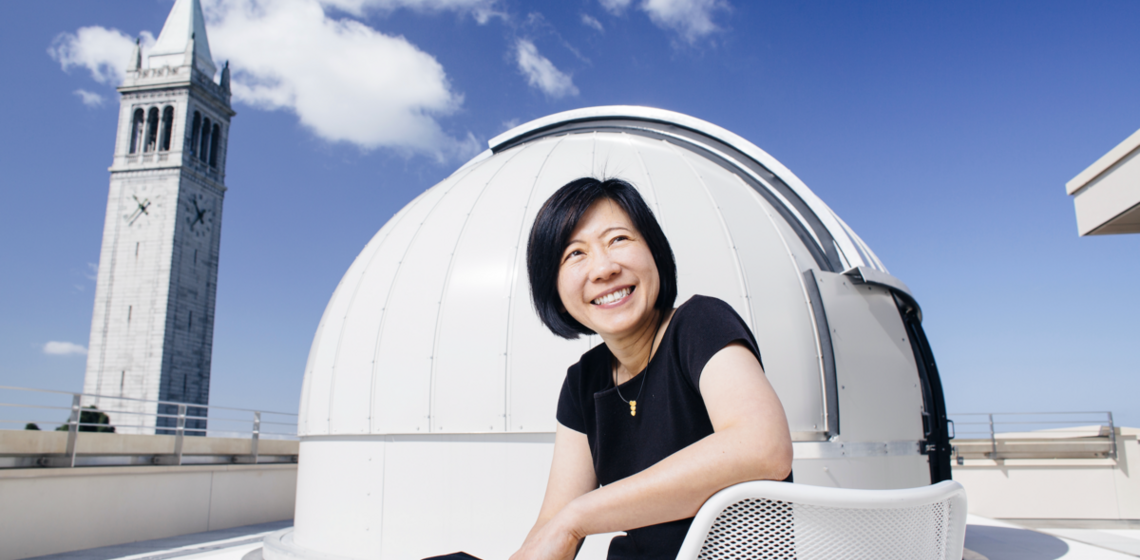
Campbell Hall Rooftop Dome Observatory
The Rooftop Dome Observatory, featuring the Richard Treffers Telescope, is just one of many department research and observing resources. Photo by Michael O’Callahan Photography.

The Department of Astronomy offers undergraduate and graduate instruction in a wide variety of fields, including theoretical and observational astrophysics; infrared, optical, and radio astronomy; galactic structure and dynamics of stellar systems; high-energy astrophysics and cosmology; and spectroscopy. A considerable amount of research and teaching related to astronomy is done in other units at Berkeley, including the Space Science Laboratory, Lawrence Berkeley Laboratory, and the Physics Department. Various professors in the Chemistry, Earth and Planetary Science, Mathematics, Statistics, and Engineering departments have an active interest in astronomy and are available for consultation.
Astronomy at Berkeley means many things: studying from and directly collaborating with the best scientists in their fields; collecting and analyzing ground-breaking data; designing and operating pathfinding instruments; and using everything from pencil and paper to massively parallel supercomputers to understand cosmic phenomena from physical first principles. Studying Astronomy at Berkeley means discovering the world beyond our own in an internationally-ranked institution.